ALL SECURITY RELATED TOPICS ON IoT wILL BE POSTED THERE
2015-10-15
>> BRINGING YOUR SOLAR INVERTER ONLINE (PART 2)
I am so happy when the sun is shining - for multiple reasons of course.
In
yesterdays
blog entry I covered the basics of understanding solar systems
with a real life example outlining how savings are really calculated.
Great for an education - but it is much more exciting to get the inverter
online so it can be monitored in real time! It really isn't a difficult process;
but note that every system will be different; however the principles remain
the same.
Before we get started - how did the last 24 hours work out for us:
               meter                     meter (export)
-----------------------------------------------------------------
15/Oct/2015:   2099                       1301
16/Oct/2015:   2106 -  7 kW import        1320 - 19 kW export

    total number of kWh generated by solar panels: 24.5 kW
Using the same calculations - $1.63 was the charge for importing
power, there is a credit of $1.35 for export and a total of
$1.28 of free energy that I would normally be paying for. A total
of -$0.99 (credit) compared to $2.07 yesterday - so it
was a better day with the difference in the clouds.
Thankfully, some grateful person from the manufacturer of my unit has put
a step-by-step guide on youtube - unfortunately; I didn't have this at the
time (you know, RTFM? pfft..) but I have watched the video and I can confirm
the steps are the same - so; maybe it is better to focus on the results.
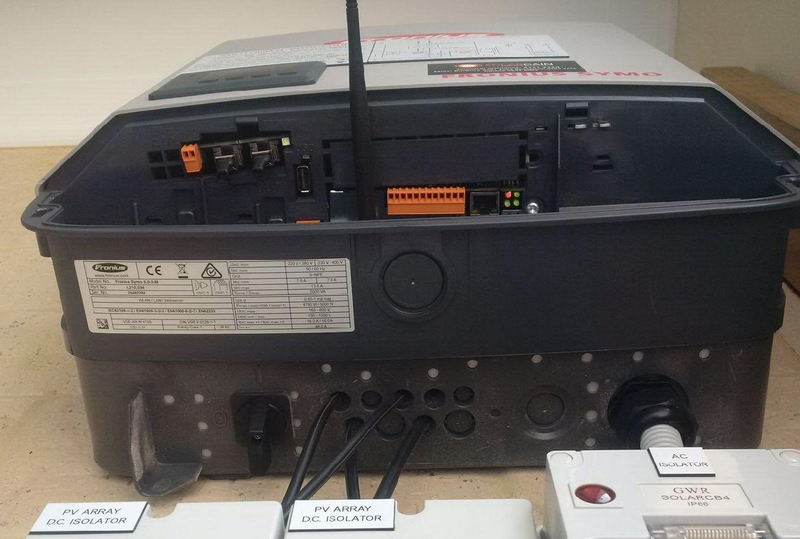
The unit comes with a "data manager" interface - which actually offers a
number of different ways to interface with the inverter; the most common
is to simply configure it to use a wireless network and broadcast the
information to the
solar.web
cloud service where you can access the data from your mobile phone or
desktop computer.
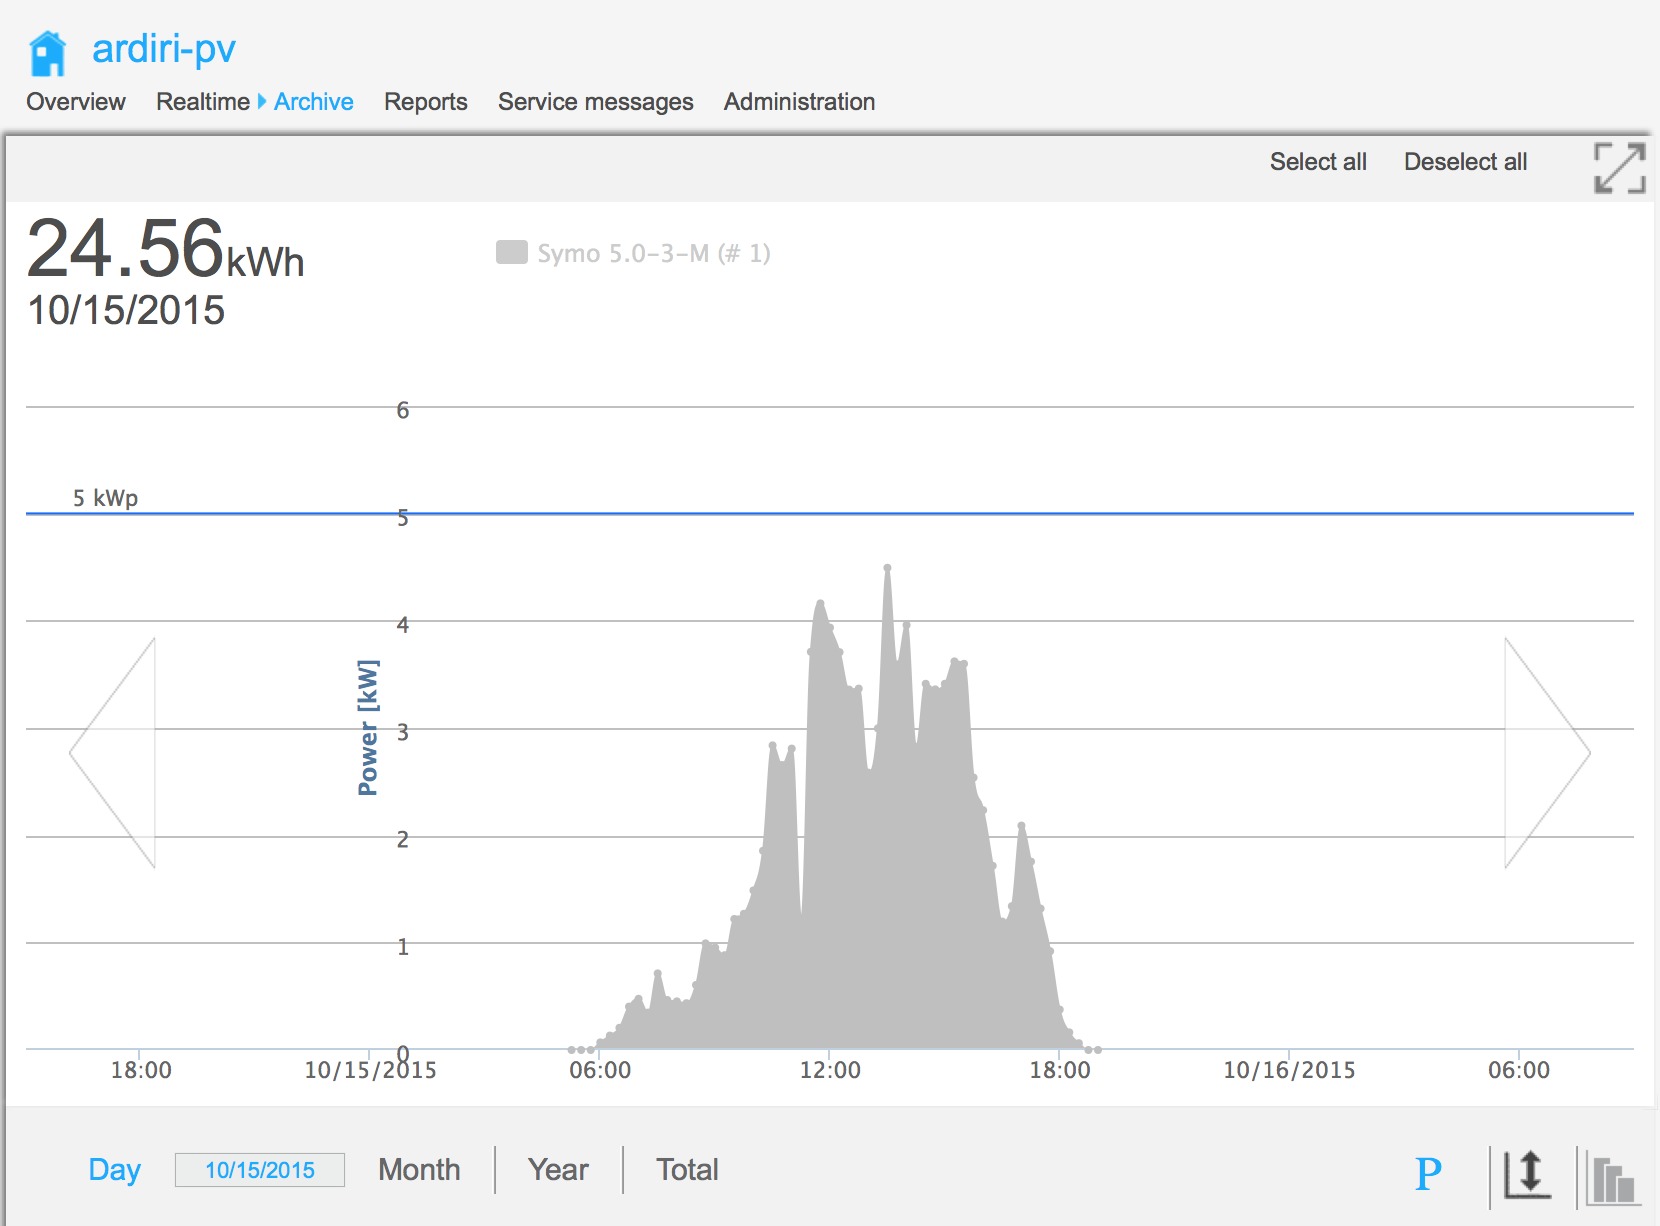
Below is a screen grab from data collection for yesterday - typically; a
nice smooth curve defines a cloudless day, but in this example it is
obvious there were periods of cloud that forced the curve to dip slightly.
It is also a myth to think the best time for collection is summer - as
temperature also has an impact on the efficiency of the panels - as does
the angle in which they are mounted.
Depending on the direction the different panels are facing; the curve
also takes on a different shape - if all panels are north (remember,
southern hemisphere) it is a relatively even curve in both the morning
and afternoon. In my setup; I have ten panels facing north, and ten facing
east. So there is a sharp build up in the morning - but, it slowly
declines as the sun sets.
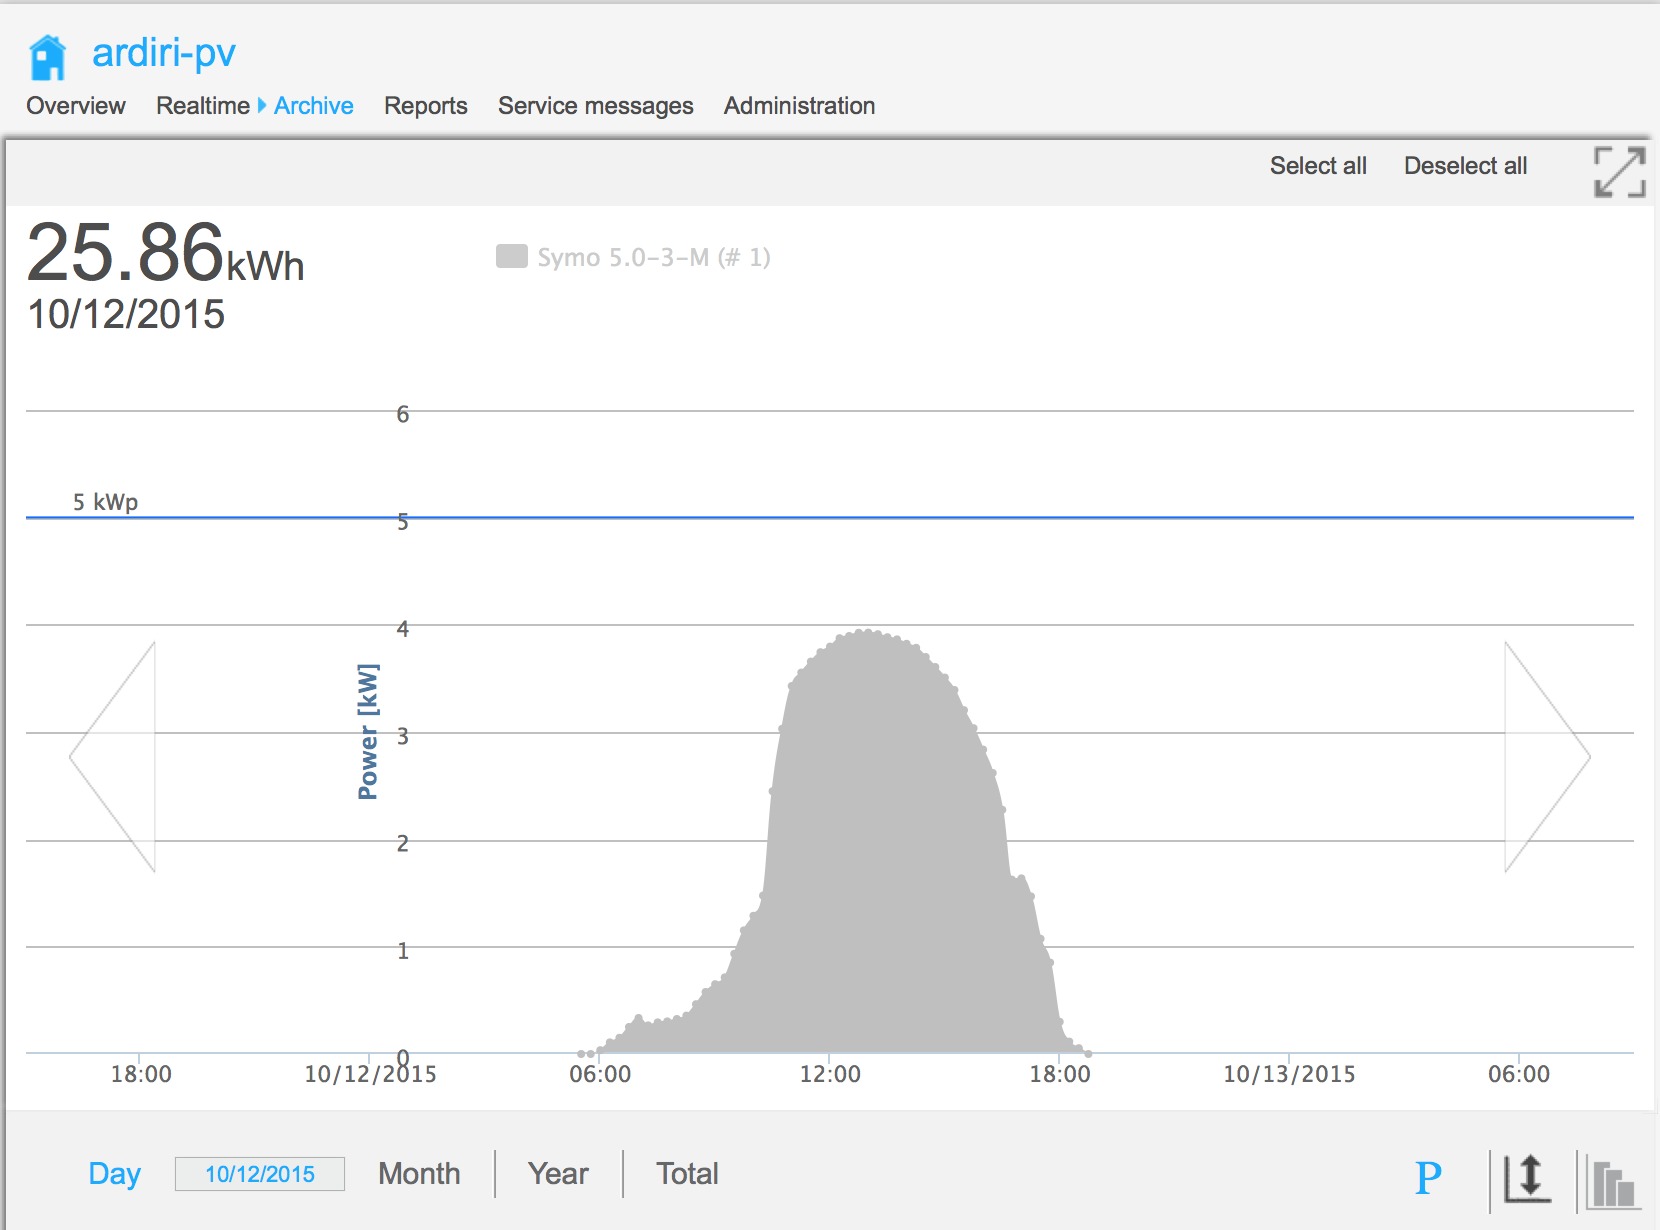
A few days earlier; there was a less cloudy day - here is how it looked:
It is much more obvious now to see the panel alignment - but in theory the
5kW system I have installed should produce around 35-40 kW when the
conditions are perfect. Of course; in the bad months (winter) - I was only
seeing 5-10 kW of power generated per day.
The Fronius inverters give quite an impressive array of options for getting
real time data from the system - I may actually investigate the Modbus TCP
and their JSON web services; it may be possible to extract additional
information that isn't exposed on the solar.web interface.
It could also be a nice way to integrate an Arduino board into the system :)
advertisement (self plug):
need assistance in an IoT project?
contact us
for a free consultation.
DISCLAIMER:
All content provided on this blog is for informational purposes only.
All comments are generated by users and moderated for inappropriateness periodically.
The owner will not be liable for any losses, injuries, or damages from
the display or use of this information.
![[Valid RSS]](valid-rss-rogers.png "Validate my RSS feed")